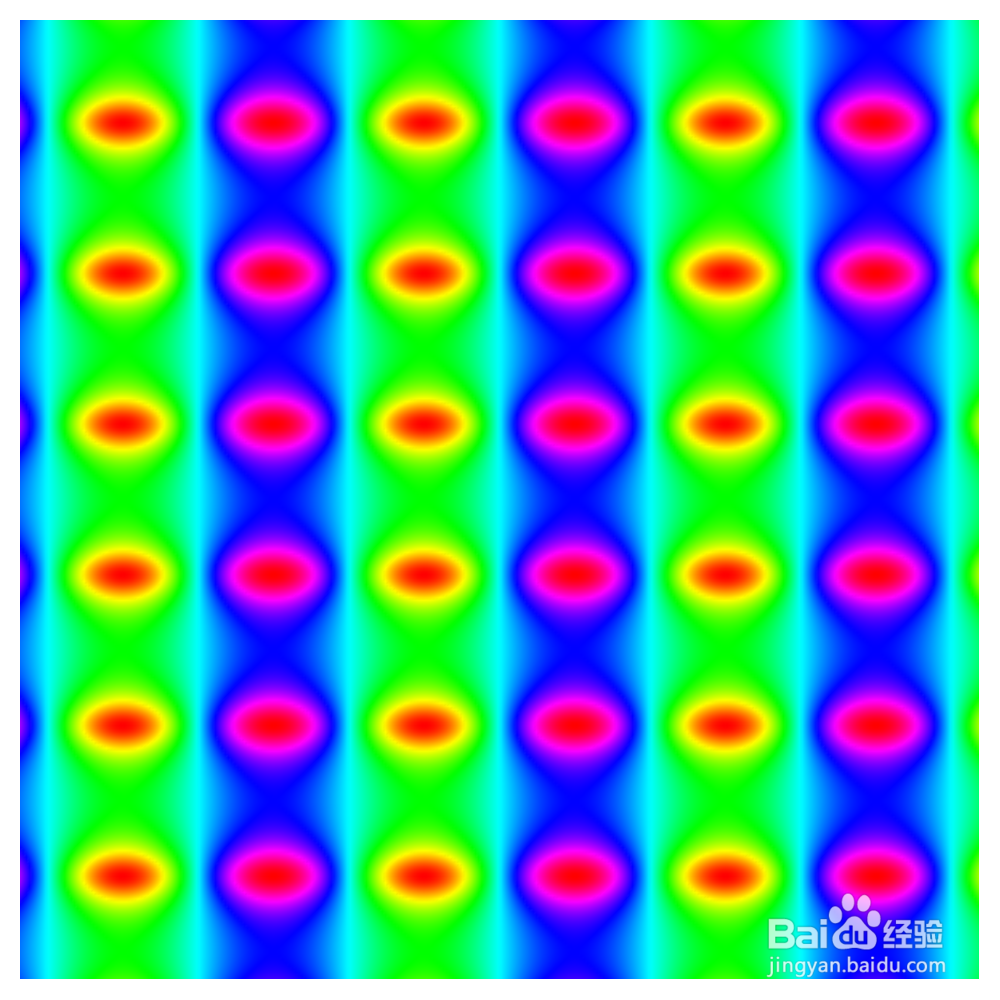
1、基本用法:
DensityPlot[Sin[x] Sin[y], {x, -10, 10}, {y, -10, 10},
ColorFunction -> Hue, Frame -> False, ImageSize -> 500,
PlotPoints -> 300]
PlotPoints后面的数值越大,图像越清晰。
Sin[x] Sin[y]的双周期性,是不是一目了然?

2、Sin[x] Sin[2 y],两个最小周期不相等。

3、Sin[x] Sin[x + y],斜着排列的格子。
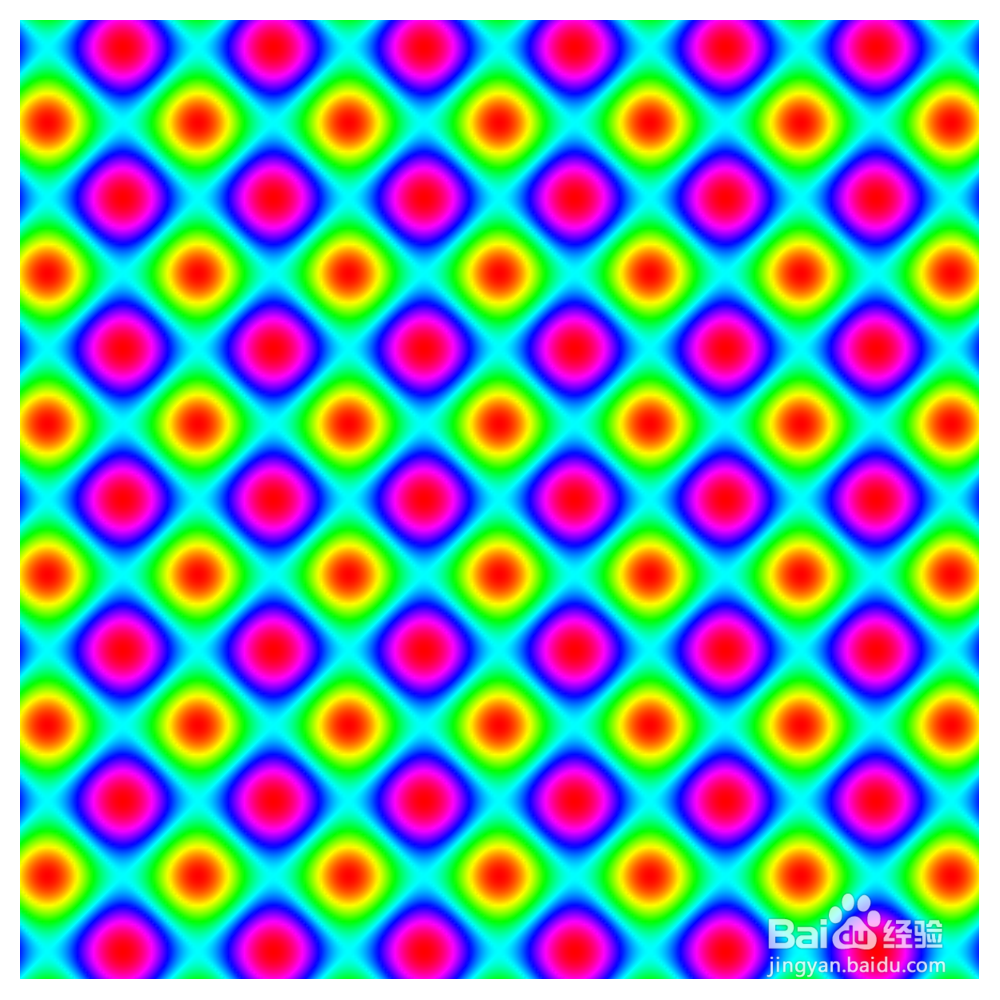
4、Sin[x - y] Sin[x + y],45°斜向排列的方格。
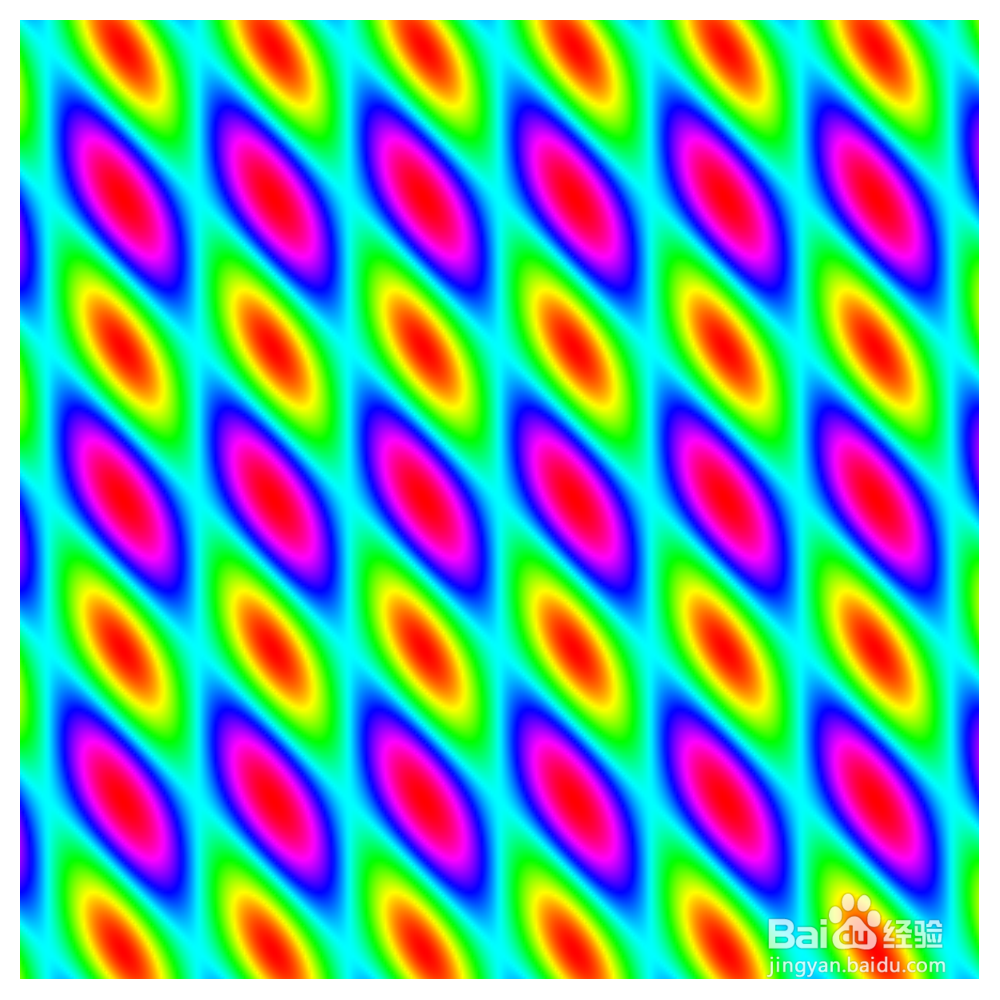
5、Sin[x - 2 y] Sin[x + 2 y],菱形格子。

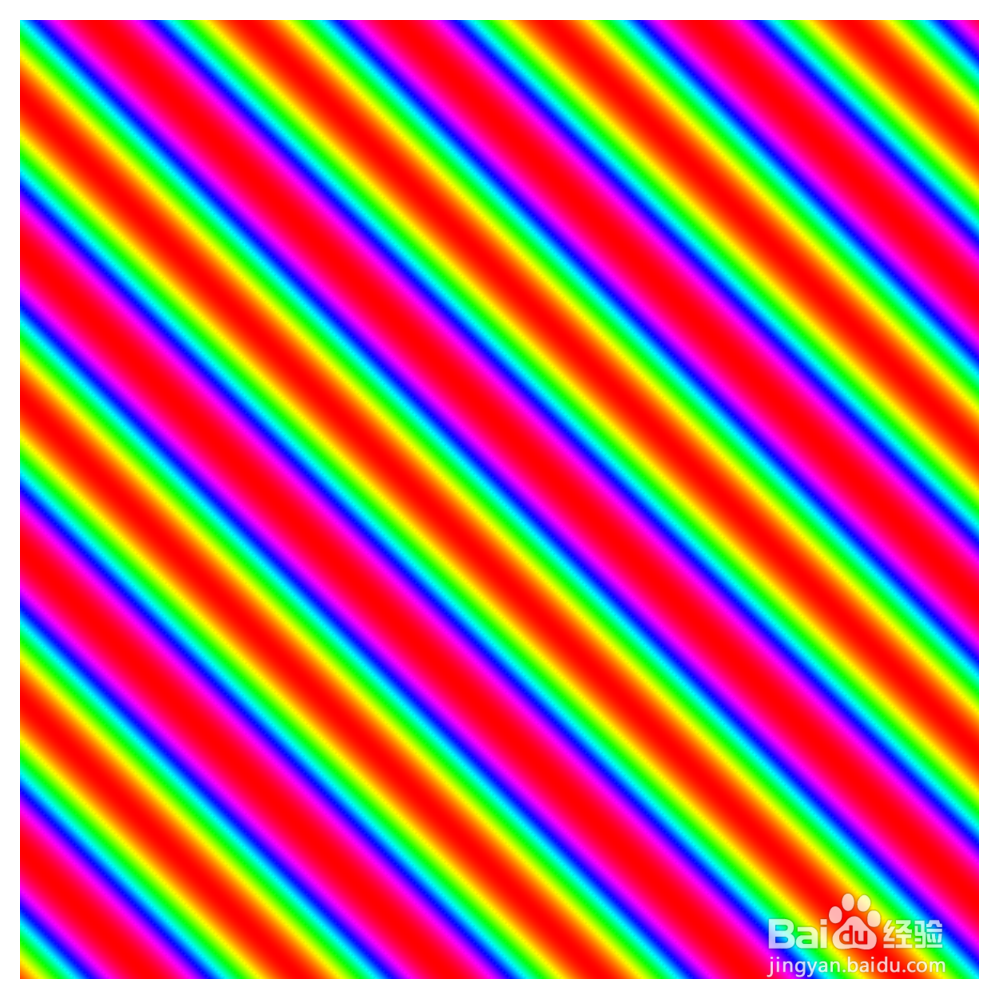
6、Sin[x + y],这是双周期吗?
7、Sin[x + y] Sin[x + 0.5 y]:

8、Sin[x]/(2 + Cos[2 y]):