时间:2026-04-25 05:50:58
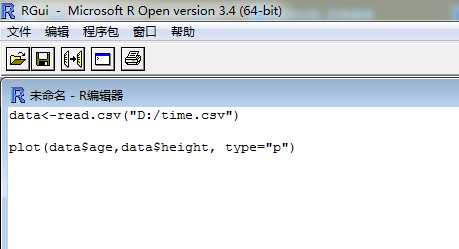
1、打开R 语言软件,导入数据集data
2、做图
plot(data$age,data$height, type="p")
age为x坐标轴,height为y轴,P 表示point(点)
3、做图结果如下图所示